Building Models and Geoprocessing in ArcPy
A- Model Builder In Arc GIS Pro


This definition above is pretty straightforward according to Wikipedia...
ModelBuilder is a visual programming language for building geoprocessing workflows. Geoprocessing models automate and document your spatial analysis and data management processes. You create and modify geoprocessing models in ModelBuilder, where a model is represented as a diagram that chains together sequences of processes and geoprocessing tools, using the output of one process as the input to another process. - Esri
 |
| Example from Esri's Website |
https://pro.arcgis.com/en/pro-app/latest/help/analysis/geoprocessing/modelbuilder/what-is-modelbuilder-.htm
So now that we know what a model is, and what it looks like in Arc GIS Pro, Let's get to it!
To begin working with this model, we need to open up Arc GIS Pro.
- Go to the Analysis Tab in your Project
- Click Model Builder
- Give your model a name and save it
- Now we can start Geoprocessing!
- Add data into your model, these will appear as variables or blue circles
- Search the analysis toolbar for ArcPy Tools and Scripts, and drag them into your model
- Define your output data
- Pull In any iterators, other variables, preconditions, and or logic variables needed
- Run your model
- See Your Results!
Sounds Pretty Easy Right?
Well it's not until you get used to it...

For this model, we selected the input data in the Arc Pro Project


B- Geoprocessing with Python Scripting: ArcPy
Each step is logged in the terminal with the script's start time, end time, and the tool's name that is running at that point in time.
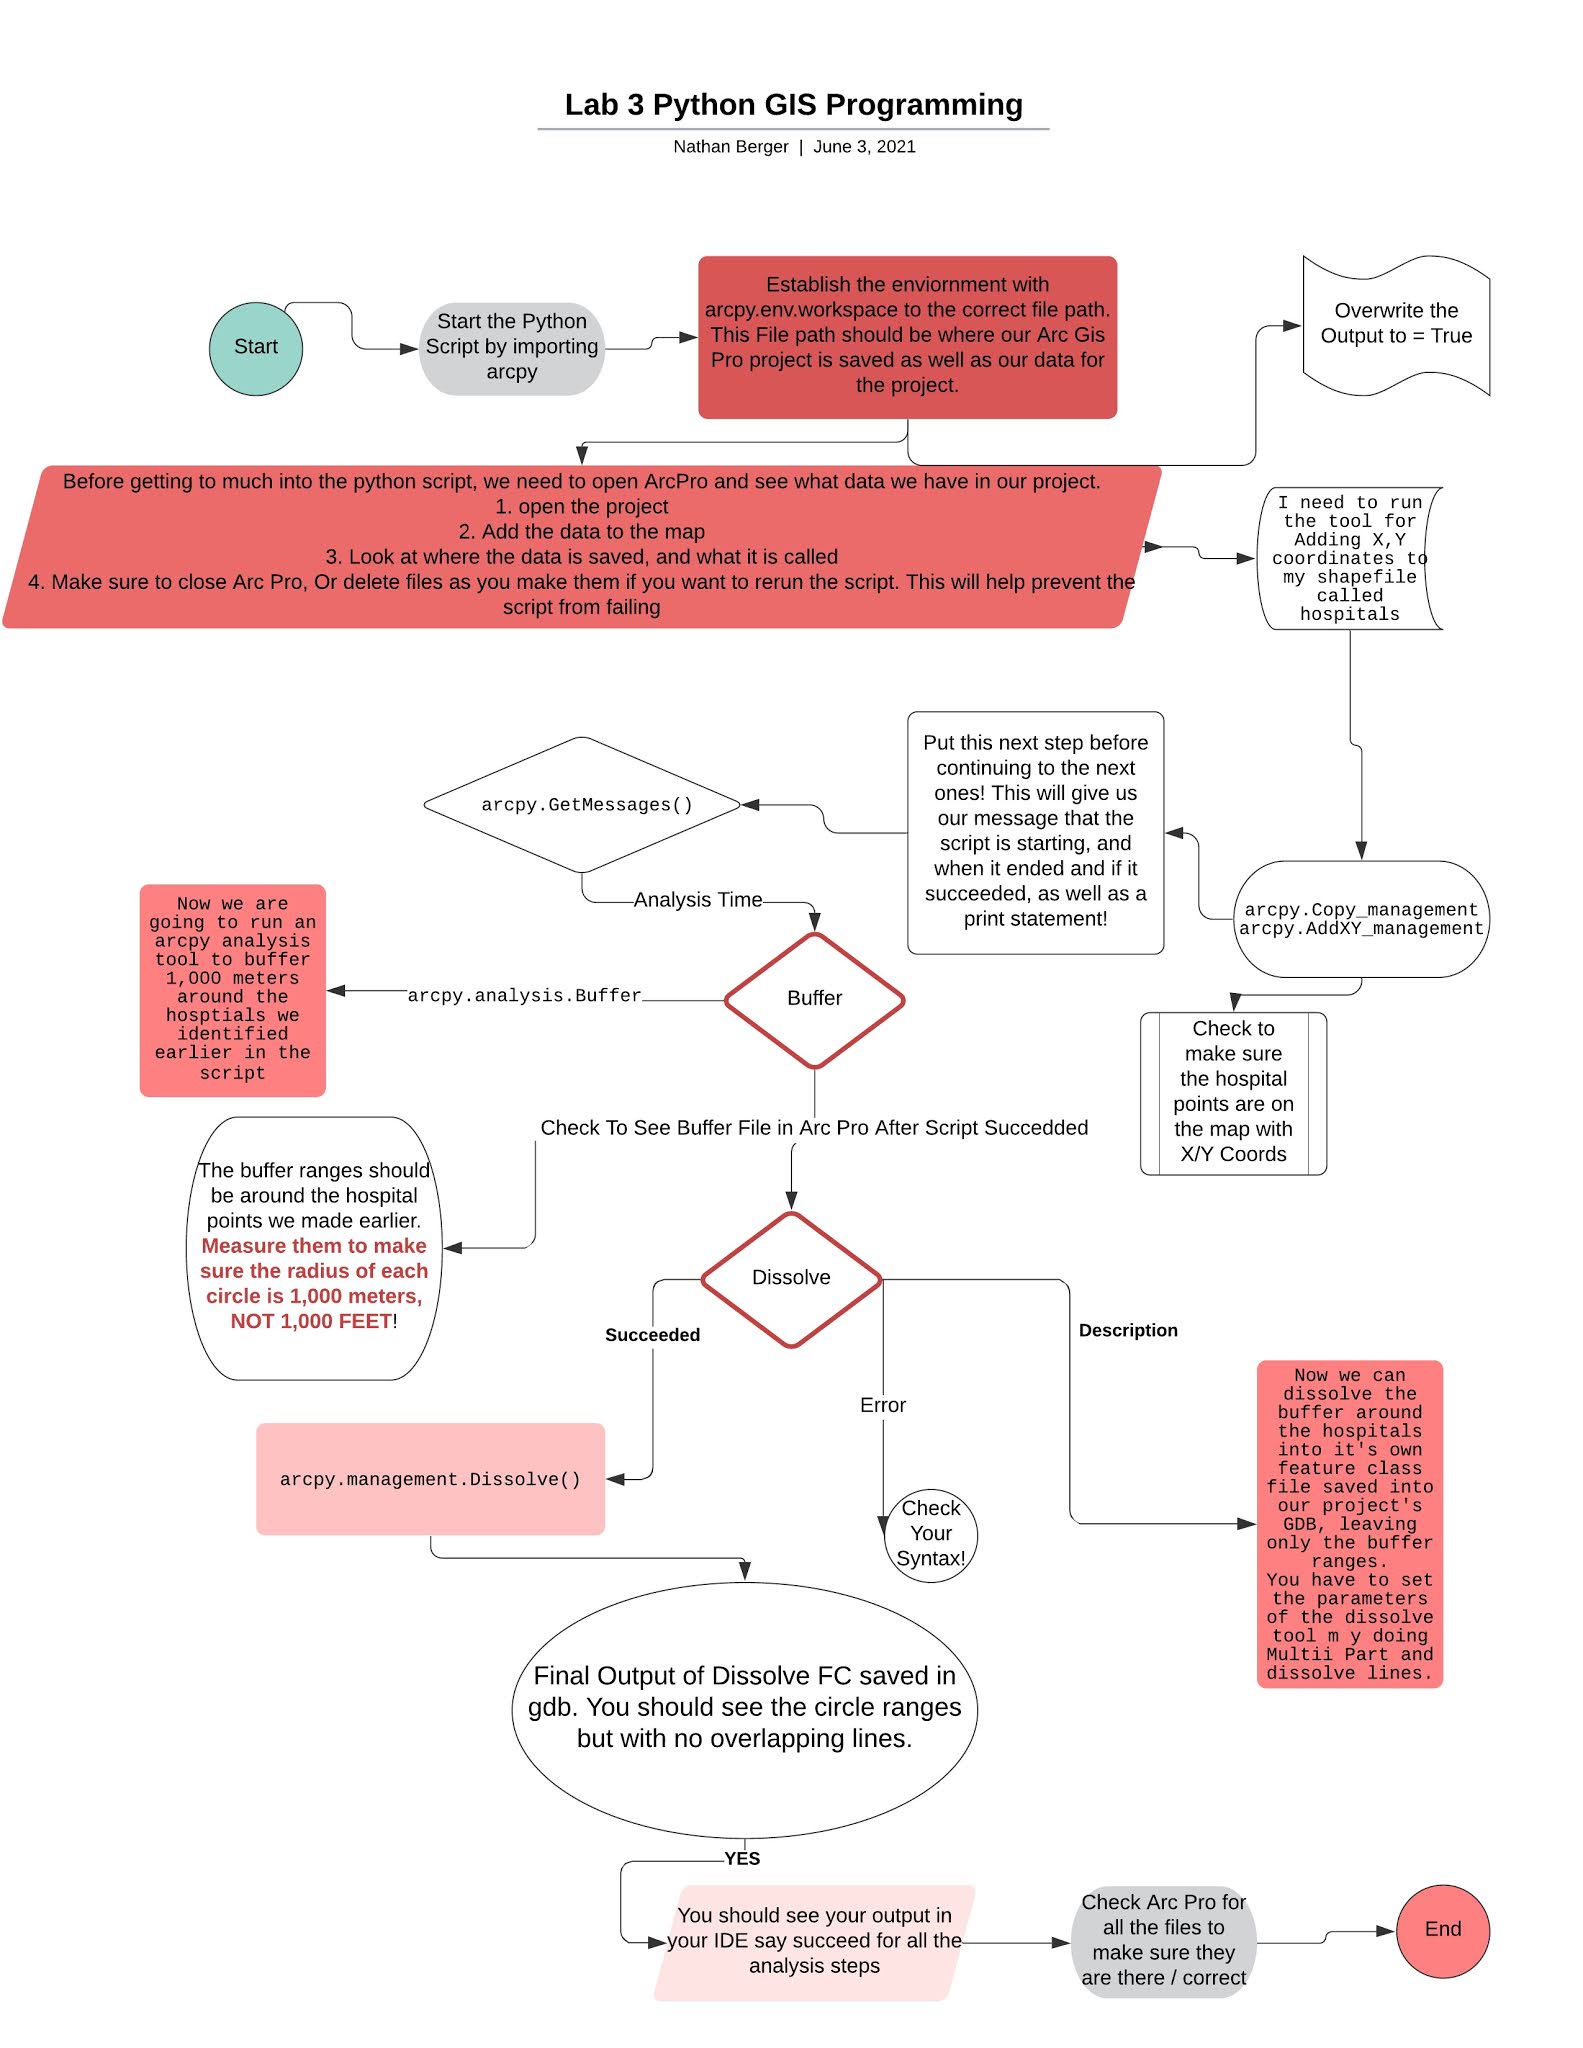
Steps that my flow chart above explains in full detail:
1
XY Coordinates – In order to add X
and UY coordinates to the hospitals shapefile, I wanted to copy the file first
using the arcpy.Copy_management tool to create my new shapefile. I then ran the
AddXY_management tool to get the coordinates added to the attribute table for
my hospitals.
https://pro.arcgis.com/en/pro-app/latest/tool-reference/data-management/add-xy-coordinates.htm
2
Buffering – The buffer analysis was
tricky with setting the units of measurement. I needed to run the
arcpy.analysis.Buffer and I input my hospitals XY shapefile, then set the new
shapefile’s name that I was creating (hosXY_buffer, and then I sett ;the buffer
to “1000 Meters”. This was trial and error because originally, I left the 3rd argument
as 1000 which defaulted to U.S. Feet since the hospitals shapefile is in a
spatial reference of a state plane coordinate system that is in U.S. Feet. When
I measured by buffer circles around my hospitals, they seemed small. So, after
measuring, I realized that I needed to change my 3rd argument to be
1000 Meters to define my unit of measurement.
https://pro.arcgis.com/en/pro-app/latest/tool-reference/analysis/how-buffer-analysis-works.htm
3
Dissolve- The last tool in my script
required me to dissolve the buffer rings I just made, so I ran the
arcpy.management.Dissolve() and passed in my previous created file, then set
the new file name to be hosXY_buffer_Dissolve, but then things got challenging.
I set the next two arguments to NONE as they are optional to fill in. I then
set the 5th argument of my tool to Multi Part, and the last one was Dissolve
Lines. This allowed my dissolve tool to get rid of the overlapping lines that
my buffer file was displaying around the hospitals.
https://pro.arcgis.com/en/pro-app/latest/tool-reference/data-management/h-how-dissolve-data-management-works.htm
4
Printing out the terminal output – I
ran a print statement after each tool that I ran using the arcpy.GetMessages()
which returns an index of messages for running a tool .This includes the start
time, errors, if it succeeded, when it succeeded, and the time that it took to
run this tool. I also concatenated a + “\n” to create a space between each
script’s output in my terminal.
https://pro.arcgis.com/en/pro-app/latest/arcpy/functions/getmessages.htm
5
Importing modules / Overwriting the
Output / Workspace- I imported ArcPy, set my workspace to arcpy.env.workspace =
“my file path to my project in module 3”, and then I set my arcpy.env.overwriteOutput
to True so I would not have to delete the files that I kept creating in my
script as I was running and testing my Python file.
https://pro.arcgis.com/en/pro-app/latest/arcpy/get-started/importing-arcpy.htm
6
Checking arc Pro for results –
During my script and at the end of my script, I made sure to check the files in
Arc Pro to ensure my script ran correctly. The files were locked so I had to
save arc Pro and close the software when running the IDE. However, since I did
the step above with the overwrite Output = True. I did not have to delete the files
I created every time I ran the script. I made sure the hospitals XY shapefile was correctly on the map with X and Y
coordinates in the attribute table, then I check ed for the buffer ranges
around the hospitals. I then looked in the project’s GDB to ensure the buffers_dissolve
feature class was there, and that the buffer ranges showed the dissolved buffer
rings around the hospitals in the dissolve feature class. I also measured the
buffer rings to make sure they were 1,00 meters (the first few times I ran the
tool the ranges ended up being in feet and not meters).
Double Checking Your Work Is Crucial!
Final Output:

 |


This is awesome 👍
ReplyDelete